
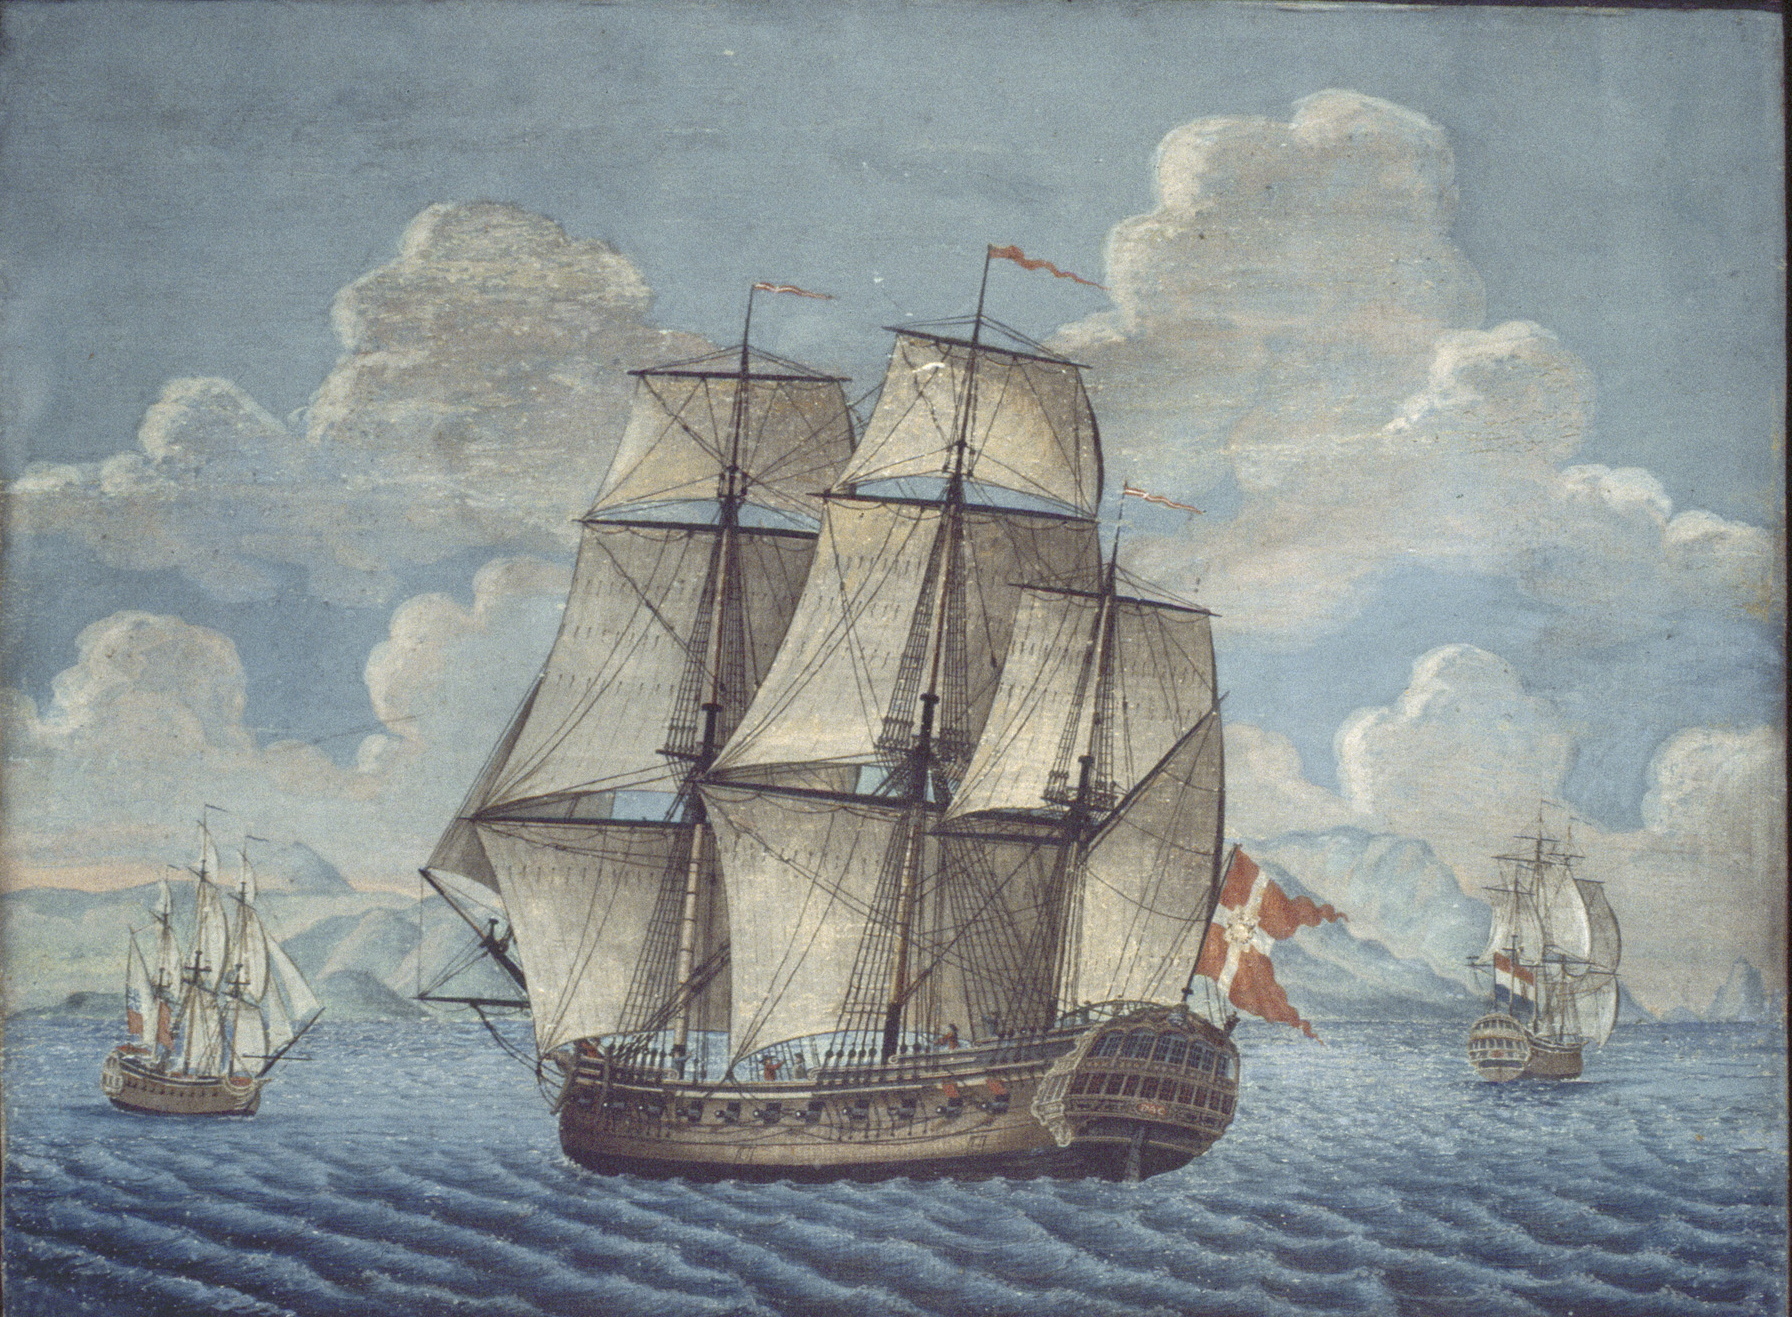
The Chinaman FREDENSBORG SLOT from the Danish Asiatic Company. Built in Copenhagen 1763-64. From gouache by Clement Mogensen Clementsen, about 1765. Photo: Maritime Museum of Denmark.
For the last several months have been sending in homework every tenth day for an interesting PhD-course in Social Network Analysis.
Next week I am going to attend the course in France, and I have just finished the last assignment, which used my own data, so I thought I would share the results here.

The somewhat complex diagram above shows the connections between the merchants of DAC ships going to China from 1747-65. The data comes from the DAC roll books.
Click on the drawing for a larger version.
Every blue square is an expedition of a ship and the lines connecting the squares show that those particular expeditions included one or more shared merchants. A thin line indicates that perhaps only a single merchant participated in the same expedition, while the thicker lines show that up to seven merchants participated in the two voyages.
So what does this complex graph tell us?
Well, since the trading section of a crew of a Danish Chinaman in the period typically was from 7-12 persons, where usually 2-4 would be servants and scribes, then it seems that a large portion of the trading crew was simply transferred from ship to ship at the end of each expedition.
That implies there would be a large build-up of knowledge and know-how, making the trade more efficient. Correspondingly the wages of the traders seem at first glance to correspond very well with the number of expeditions a trader had completed.
I am sure the graph also means much more, but I will most likely not be aware of it until after the completion of the course next week 🙂
